The S&P 500 fell over 10% in the 10 trading days following the index’s all-time high on January 26th, with many speculators pointing to the short-volatility trade blowup and oncoming inflation fears as primary causes for the selloff. Many articles also pointed a finger at risk-parity strategies for exacerbating the downturn, which was met with scathing responses by the leading strategists in the risk-parity space (including AQR’s Cliff Asness and Bridgewater’s Ray Dalio). Though I am not interested in debating investing titans, we had highlighted risk-parity as one example of investment strategies that use backward-looking volatility metrics as a portfolio weighting mechanism. We’ve also discussed that these types of strategies could be forced to de-lever into a significant volatility spike. Whether these strategies are large or reactive enough to intensify a relatively modest equity market drawdown—the S&P 500 is still positive on the year as of February 15th—is probably not knowable. With that said, this 10% short-term move in the equity market is likely not enough to cause a cascade of selling by risk-parity strategies. A prolonged and deeper equity market drawdown, however, could produce a re-calibration of these strategies, forcing them to materially lower their equity allocations.
The recent market selloff did, however, test a fundamental assumption underpinning not only risk-parity strategies but also widespread portfolio construction principles. Embedded in the risk-parity portfolio, as well as most asset allocation strategies, is a “short-correlation” trade, meaning the portfolio relies on certain assets offsetting risks from others. This is an assumption we all hold at some level, and it is the underlying rationale for most disciplined asset allocations including a mix of stocks and bonds. The simplest example of the short-correlation assumption is indeed a traditional stock and bond portfolio; the portfolio manager relies on bonds at least partially offsetting the risk of the stock portfolio. For the last 20 years or so, this assumption has been, for the most part, dependable, with stock-bond correlation reliably low or negative as evidenced in the chart below.
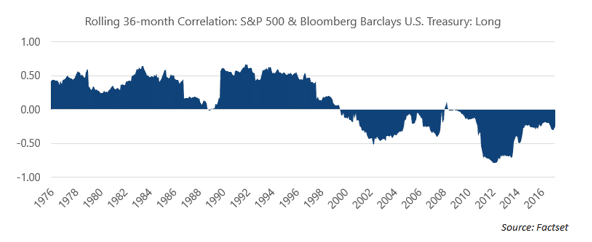
An inflation scare, however, challenges a portfolio built on reliable correlation assumptions because upside inflation surprise is a headwind for both stocks and bonds. Recent months have seen inflation fears surface as the economy reaches full employment, wages grow, rates rise, and the budget proposal out of Washington is expected to result in a $1 trillion budget deficit. Now, I understand that the “rising wages and full employment are bad for the market” argument sounds like one of the painfully obtuse things that dispassionate Wall Street folks say. However, understanding the impact of inflation surprise on stock and bond prices is important to understanding why a strong payroll or wage growth number can send the market into a tailspin.
The impact that rising inflation expectations have on bonds is relatively understandable and straightforward. If you are a debtholder, per the Fisher equation, the real interest rate you receive on the bond becomes less attractive as the aggregate price for goods and services rises. This erosion of purchasing power of the bond’s future cash flows causes yields to rise to recoup losses in real interest rates (causing bond prices to fall). Put another way, bonds are repriced to reflect this increased inflation risk.
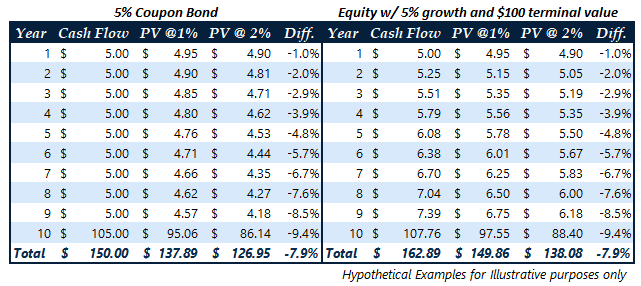
The impact of inflation on stocks is more nuanced and is linked to the relationship between corporate profits and interest rates, and thus inflation, much like one views the relationship between bond payments and interest rates (inflation). As we’ve already established, an inflationary environment generally causes interest rates to rise. If one views a stock as a claim on the perpetual earnings of a company, the present value of those earnings will ultimately drive what an investor is willing to pay for the stock. We’re going to delve into Time Value of Money 101 for a moment. A present value calculation is very sensitive to the assumed discount rate, regardless of whether the cash-flowing asset is a stock or bond. For example, let’s evaluate a hypothetical example of two assets at different interest rates. The first asset is a 5% coupon 10-year bond, and the second is an equity-like cash flow stream, with 5% embedded earnings growth and a terminal value of $100. The table below shows the present value of those cash flows at discount rates of 1% and 2%. You can see that the increase in discount rate from 1% to 2% results in a more than 7% reduction in the present value of both assets. Note that this example borrows from our April 2017 commentary entitled “Negative Interest Rates: Go to the Mattresses,” in which we discussed the impact of negative interest rates on equity valuation.
It would be fair to say that corporations are different than bonds regarding the variability of profits; it’s possible for a company to offset surprise upside inflation’s impact by raising its prices in kind, preserving the profitability it had prior to its increase in input costs due to inflation. However, reality is a bit different: supply and demand as well as contracts to provide services at a predetermined price preclude companies from quickly raising prices across the board to offset inflation-related input price increases. As a result, the company’s profits fall and the stock is less valuable.
As may be clear by now, unexpected inflation can potentially drive a wedge in the negative correlation relationship between stocks and bonds by decreasing both at the same time in an inflationary environment. If one depends on stocks and bonds to hedge each other, it may be time to shift your thinking; not only are we are in the midst of an environment that is seeing elevated stock valuations, low yields, and historically tight credit spreads, we are also starting to see signs of inflation that could potentially reduce the effectiveness of the diversification benefit relied upon by most investors and portfolio managers these days.
It is clear that inflation fears are beginning to surface among investors and these concerns are likely at least partially responsible for the recent uptick in equity market volatility and the spike in interest rates. We also think the short-volatility meltdown and general deleveraging played a role; the weak response from commodity markets during the equity correction certainly counters the inflationary scare narrative. Still, investors should take note of the relationship between inflation and stock/bond valuation. With rising inflation fears in the United States fueled by continued fiscal stimulus (deficit spending) and other factors, investors would be wise to explore assets that can protect portfolios in a prolonged inflationary environment.
-A.G.
Markets started 2018 by continuing last year’s strong trend, as expectations for global growth remain solid and the recent US tax reform bill led to forecasts of higher corporate earnings. US Large Cap stocks, as measured by the S&P 500 index, gained 5.7% for the month, the strongest January return since the 6.25% return in January 1997. The S&P 400 Mid Cap index gained 2.9% while small cap stocks, measured by the Russell 2000 index, rallied 2.6% in January. The MSCI EAFE Index, an index of international developed stocks, gained 5.0% for the month. Emerging markets continued to outperform the developed headline indices, with the MSCI Emerging Markets index gaining 8.3% in January.
The S&P 500 started out the year on a tear, gaining nearly 7.6% through January 26th, before fading in the final days of the month, as rising interest rates and hawkish Fed comments stirred inflation fears. Market volatility, as measured by the CBOE Market Volatility Index (VIX), rallied over 22% in January, closing the month at 13.54 after closing 2017 at 11.04. The VIX spiked 24.9% to 14.79 on January 29th, as the US 10-year Treasury yield broke through the psychologically important 2.7% level, further stoking inflation fears. At the sector level, the income-sensitive sectors Utilities [-3.1%] and Consumer Staples [+1.6%] lagged the market, while Consumer Discretionary [+9.3%] and Technology [+7.6%] led markets higher. Despite the continued market leadership of Technology stocks—the S&P 500 Technology sector index has gained over 43% in the last 12 months—the CBOE NASDAQ Volatility Index (VXN), which tracks the implied volatility of options on the NASDAQ 100 Index, rose 25.3% in January. The VXN is linked to technology stocks because its underlying index, the NASDAQ 100, is approximately 60% tech, compared to the 25% technology sector weighting of the S&P 500.
Headline Fixed Income market indices struggled across the board in January, as rising interest rates offset continued tightening in credit spreads. The Bloomberg Barclays US Aggregate Bond index returned -1.2% for the month to bring its rolling 12 month returns to 2.1%. US Treasury rates rose sharply in January, as the 2-year Treasury rose 26 bps to 2.14%, the 10-year Treasury rose 31 bps to 2.72%, and the 30-year Treasury rose 20 bps to 2.94%. High yield credit spreads, as measured by the BofA Merrill Lynch US High Yield Option-Adjusted Spread, contracted 34 bps to close January at 3.29%, the index’s lowest monthly close since June 2007. Global interest rates also rallied sharply; the 10-year bonds for the UK, Germany, and Japan rose 32 bps, 27 bps, and 4 bps to close the month at 1.51%, 0.69%, and 0.08%, respectively.
The S&P GSCI Total Return index gained 3.4% in January, led by a 5.0% gain in the Energy sub-index. West Texas Intermediate (WTI) Crude Oil led the Energy complex higher, closing the month at $64.77/bbl., up over $4 from December’s $60.40/bbl. close. The oil markets received many bullish headlines throughout the month, including continued solidarity between OPEC and Russia, upside demand surprises, and unexpected inventory draws. Gold also rallied on inflation fears, though hawkish signals from the Federal Reserve sent Gold futures prices lower at the end of the month. After closing December at $1,305/oz., Gold rallied over 4% to $1,357.80/oz. on January 24th. However, during the Fed’s policy meeting—the last of the Janet Yellen era—officials highlighted signs of inflation growing and hinted at additional rate hikes this year. The Softs commodity index, which includes non-livestock agricultural commodities, fell 6% on the month, led lower by a -12.6% return in Sugar, which fell on higher than expected output and weak demand.
The US Dollar Index, which measures the US Dollar’s value against a basket of 6 foreign currencies, returned -3.25% in January, continuing last year’s trend of poor returns. The USD depreciated against all major currencies, led by its 5.3% depreciation against the Mexican Peso. The greenback’s slump accelerated in mid-January on comments by Treasury Secretary Mnuchin at the World Economic Forum in Davos, Switzerland. In Davos, Mr. Mnuchin signaled his comfort with a weaker US Dollar, which he expected to benefit trade.
We’re thankful for your continued interest and feedback. As always, please reach out any time with your questions and feedback.
Sincerely,
Arthur Grizzle & Charles Culver
Managing Partners
Martello Investments