The S&P 500 saw a greater than 4% decline, and the over 115% daily move in the CBOE Volatility Index (VIX) was easily the largest one-day spike on record, surpassing the 64.2% move in February 2007. This caused a catastrophic loss in inverse VIX exchange-traded products (XIV, SVXY) with early estimates putting the daily loss on those securities at greater than 95%. As many of you know, we run a volatility trading strategy that utilizes short-VIX ETPs at times. This trading strategy is incorporated as a portion of our systematic multi-strategy programs as well.
The S&P 500 saw a greater than 4% decline, and the over 115% daily move in the CBOE Volatility Index (VIX) was easily the largest one-day spike on record, surpassing the 64.2% move in February 2007. This caused a catastrophic loss in inverse VIX exchange-traded products (XIV, SVXY) with early estimates putting the daily loss on those securities at greater than 95%. As many of you know, we run a volatility trading strategy that utilizes short-VIX ETPs at times. This trading strategy is incorporated as a portion of our systematic multi-strategy programs as well.
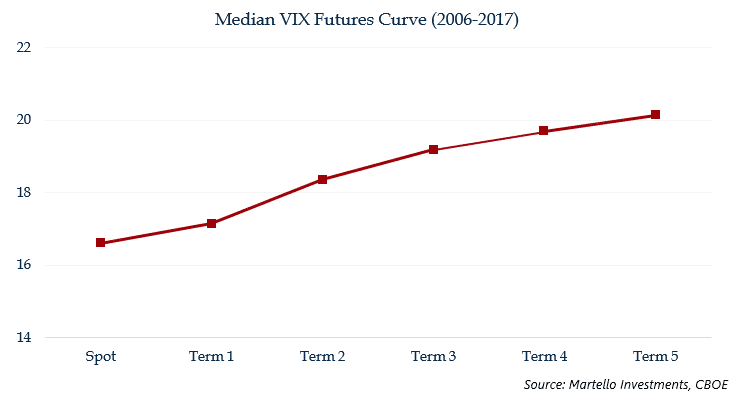
XIV is an exchange-traded note that tracks a short position in the front two months of the VIX futures curve. Its counterpart, VXX, tracks a long position in the front two months of the VIX futures curve. The VIX-linked ETPs have two main sources of return: the move in the VIX futures they hold and the embedded roll yield in the mechanics of the ETPs. To understand the impact of changes in market volatility and the VIX index on XIV and other VIX-based ETPs, you must first analyze the VIX futures curve. The VIX futures curve is positively sloped (in contango) over 80% of the time. Each day, the VIX ETPs roll a portion of their respective positions to the next month. For example, VXX, which is “long-VIX,” must sell a portion of its exposure in the first month and buy a small position in the second month (at a theoretically higher price). This causes a “decay” whereby the long-VIX ETPs lose value every day that the market is stable because they are, in effect, selling low and buying higher. The inverse VIX-linked ETPs (such as XIV) do the opposite; as XIV is short the front futures contract, each day it must cover (buy) a position in the front month and sell (short) a position in the second month. Also, as VIX futures slide down the curve, converging on the lower spot prices in contango, long VIX positions pay time premium (lose), while short VIX positions capture this premium in a stable market environment. This “positive roll yield” is generally what leads to the extraordinary returns of the short-VIX ETPs in stable market environments.
The obvious risk to XIV holders is a rapid increase in spot VIX, which causes not only a loss on the underlying futures positions but also causes the futures curve to slope negatively (that is, the curve is in backwardation). This turns the positive roll yield dynamics of XIV and the negative roll yield dynamics of VXX upside down.
In addition, XIV's underlying holdings are short positions in VIX futures and rebalanced daily, forcing it to cover its position into a VIX spike, which is what happened Monday. This is obvious but bears noting nevertheless... A VIX spike of over 100% in a single day effectively causes a margin call for products that are short futures at the front of the curve (XIV/SVXY). This is similar to being short a stock with 100% of your portfolio, and seeing it double in a day.
As we discussed in our December market commentary, the inverse VIX-linked ETP space provides opportunities but also significant risks. Therefore, we discussed sizing the position appropriately as well as, in our case, using a rules-based methodology to potentially reduce risk. From our commentary:
We do agree with the bears on one crucial point: it is a question of when, not if, short-VIX products will incur another large drawdown. This means that investors that choose to enter the short-vol trade through inverse VIX-linked ETPs should be prepared for significant bouts of interim volatility, including potentially large drawdowns on those positions. For those already interested in the space, we would advocate sizing exposure prudently (possibly incorporating short-vol exposure as part of an equity replacement strategy) and utilizing a rules-based, risk-managed approach that can participate in the large upside returns available in the short-vol trade, while potentially limiting drawdown.
Our volatility strategy has the mandate to invest in VIX-linked ETPs (long or inverse) depending on market environment, or a group of “risk-off” assets in the absence of an opportunity in the VIX ETP complex. Our tactical approach to the VIX ETP complex is value-oriented and utilizes a number of different inputs. As the strong equity bull run accelerated in the first weeks of January, the “value” that we had seen in the inverse ETPs in the fourth quarter had significantly eroded, and as the VIX drifted from 9 to 12 in the middle weeks of January, our model generated a “risk paring” signal. This caused us to de-risk on January 22nd by moving from XIV to ZIV, which is short further out on the futures curve and generally has less beta to a spike in VIX. On January 30th, 8 days later, we exited ZIV after our model’s signals for that security similarly eroded. Little did we know that such a historic event would take place soon after.
1. We take some comfort in the fact that our tactical approach got us out of the trade. Monday was a classic panic. Those that tried to “buy the dip” without understanding the impact the move had on the underlying futures and the mechanics of the ETPs have likely experienced unrecoverable catastrophic losses in their positions. Our approach caught levels of increasing risk in the weeks leading up to Monday’s move. We feel this illustrates the benefit of using a data-driven, value-focused methodology to help manage risk, especially in these extremely risky securities.
2. The move on Monday drives home the idea that sizing positions appropriately is critical, appropriately reflecting the risk in the trade. Investors that utilized a static allocation to XIV in their portfolios without active trading may now, in retrospect, know fully why position sizing was crucial to limiting the damage from this violent move. Paraphrasing our December commentary:
The role of short-volatility strategies as a portion of a total portfolio must be properly framed. We think about short-vol exposure as equity-replacement; as the VIX is based primarily on the price of S&P put options, short-VIX exposure is inherently equity-sensitive. From 2011-2017, the XIV’s beta to the S&P was over 4.5. This means that you can potentially use a 1% position in XIV to replicate a 4.5% equity position. Using this logic, a small portion of XIV in the equity portion of a portfolio (5% or so) can impact the total portfolio similarly to a 22.5% position in a stock index. Using short-vol as an equity-replacement strategy, then, would allow investors to free up additional capital and invest more defensively, putting less capital at risk and potentially limiting total portfolio risk and drawdown, while keeping the same return potential as a higher equity portfolio. For example, an investor could replicate a 60% equity position with 5% XIV (assuming 4.5 Beta), and 37.5% S&P 500, freeing up an additional 17.5% of capital to invest more defensively. We can test this theory to the inception of VIX futures in 2004 using VIX ETP Extension Data from SixFigureInvesting.com*. Below we present the results of a simple simulation, for illustrative use only, using two asset allocations, both rebalanced monthly:
“Traditional” Asset Allocation: 60% S&P 500, 40% Barclays US Aggregate Bond Index
“Equity Replacement” Asset Allocation: 5% XIV, 37.5% S&P 500, 57.5% Barclays US Aggregate Bond Index
The “Equity Replacement” Asset Allocation would have returned between -5.5% and -6% on Monday (based on estimates, data available upon request), depending on your rebalancing rules and the estimated losses for XIV of 95%-100%. Paraphrasing our December commentary…A massive loss, but a bearable one for investors with appropriately sized positions in a diversified portfolio with reasonable rebalancing, particularly considering the previous gains in XIV.
3. XIV has been terminated. We reached out to VelocityShares (the company behind XIV) to gauge the probability that they would relaunch the strategy in the future. So far, we have not heard back from them, as we’d imagine they are dealing with a lot over there. As of the time of this writing, ProShares has signaled its intent to keep SVXY open.
4. The move Monday is a reminder of the power of the reflexivity of volatility, the impact of leverage in the system, and the prevalence of vol-based strategies in the market. It is probably not coincidental that this move took place after one of the worst weeks for risk parity strategies in the last several years. From our December commentary:
In addition, we have discussed in other commentaries the reflexive nature of low equity volatility, meaning that falling volatility is a positive feedback loop that begets even lower volatility. Strategies that use volatility as a portfolio weighting mechanism — some examples include risk-parity, trend-based strategies, and VAR-focused approaches — continue to add to positions as volatility falls, further lowering volatility. This reflexive nature of volatility increases shock risk, particularly with the amount of leverage in the system, because rising volatility forces selling to decrease risk, which potentially begets even higher volatility, causing more selling, and so on.
And our May 2017 Commentary:
Low volatility does present inherent risks to portfolio construction, particularly for certain types of strategies that use backward-looking volatility metrics for position sizing and risk management. A well-known version of this is a metric known as Value-at-Risk (VaR); VaR’s role in the 1998 LTCM downfall and 2007-2008 credit crisis has been widely covered. Essentially, these types of models rely on, among other things, trailing historical volatility to infer how much a portfolio can lose in a given period. With such a prolonged period of benign markets, these strategies are susceptible to volatility shocks, as complacent investor behavior causes an undervaluation of the real potential losses of the portfolio. The real risk in the portfolio is only realized ex-post, when the volatility environment changes and a market shock occurs. Particularly for strategies with leverage, this could potentially lead to a cascade effect, whereby increased volatility causes further selling pressure, further raising volatility, and so on.
Thank you to everyone for your feedback. Please feel free to reach out at any time with questions or comments.
Sincerely,
Arthur Grizzle & Charles Culver
Managing Partners
Martello Investments