Remember to bring a swiss army knife because you never know when you might need one of the tools. Count yourself lucky if the only tool you use is the wine opener at the end of your trip. You plan on having fresh water throughout your 60 miles of backcountry hiking because there are outposts all along the trail, but throw a pack of Aquatabs in your pack just in case you find yourself lost. Always have a backup plan, lest you find yourself in a life-threatening situation that could have easily been dealt with had you remembered to bring that extra cord of rope. Having foresight in the context of your travels could be the difference between having to slog in cotton down a cold, rainy mountain rather than using your flint and steel to start a fire under the cover of a lean-to you put together because you had learned how important that kind of knowledge could be.
Why is investing any different? Just because we all sit at our computers watching the markets prove our ideas right or wrong every day does not mean that we aren’t exposing ourselves to the elements. The danger is real, and it can certainly affect our lives – just much further down the road. Just this weekend, I was at a wedding speaking to a relative who is looking forward to retirement in short order. For the over 30 years he’s been saving, he’s taken a diversified approach and grown his retirement account to allow for this. He said he’s one of the lucky ones; many others in his division are looking at retirement 10 or 20 years later than he is because they elected to invest only in government bonds. The equivalent of not walking the trail has amounted to these individuals finding it difficult to reach any destination. On the other side of the spectrum, one must think of the individual who tried to run the trail as fast as he could, investing only in stocks with an eye to retirement in 2008. Hopefully this individual did not turn in his forms so he can try again five years down the road.
-C.C.
Many of our recent commentaries have touched on the idea of diversification, but to date we have only discussed diversification in the traditional sense. To many investors, both professionals and the do-it-yourselfers, the idea of diversification is simply limited to the collection of asset classes one uses in a portfolio; the most common method used to achieve a diversified portfolio is to simply mix stocks and bonds. Over the last few months, we have highlighted a few ways that traditionally relied-upon diversification techniques could break down in the face of rising interest rates and overheating inflation. There is, however, another way to think about diversifying, and despite it being very important to what we do here at Martello, we have not directly addressed it to date. What we’re referring to is the idea of strategic diversification—meaning that we use multiple methods of analysis, algorithms, and signals to evaluate each market.
There are multiple benefits to using this type of approach, which notably reduces the potential risk of overloading on one factor. In fact, our research suggests that, perhaps counterintuitively, using multiple strategies in one market is a more efficient diversifier than using one strategy on multiple markets. For the institutional portfolio manager, strategic diversification is a critical element of risk management and portfolio construction. It’s why most institutions, for example, utilize both value and growth managers in equity markets. If you regularly read our monthly notes, you’ve surely seen our comments that refer to our view of risk and opportunity as “a mosaic;” this simply means that we focus on using multiple, uncorrelated models to analyze markets – each one contributing to our overall view. Though our model library covers multiple investing disciplines – volatility, value, yield, trend, momentum, etc. – a substantial portion of our approach is driven by what we call “macro/systemic indicators.” These signals are market-based indicators that give us a sense of the trajectory of the economy in general. A great example of a macro/systemic indicator is credit spreads; as macroeconomic conditions deteriorate, credit spreads generally expand in an accelerating fashion, signaling investor angst and increased fear of defaults. On the other hand, credit spreads generally trend lower when investors are bullish about economic conditions. Therefore, an investor can get a sense of market expectations about the economy moving forward by monitoring the level and changes in credit spreads.
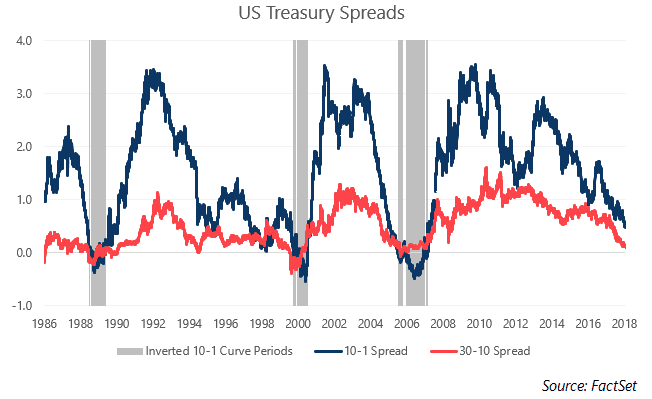
Another macro/systemic indicator used in our models, the slope of the US Treasury yield curve, has dominated headlines over the last few months. As the Federal Reserve continues its path of raising interest rates, the yield curve has flattened to a degree not seen since before the Great Financial Crisis. With the Fed likely to raise short-term rates twice more this year, many pundits believe an inversion of the yield curve is imminent. Yield curve inversion, the phenomenon where short-term interest rates are higher than longer-term rates, is very rare and usually portends a recession. In fact, a recent paper by the San Francisco Fed highlighted that all nine recessions since 1955 have been preceded by an inversion of the yield curve and had only one false positive reading (their paper uses the spread between the 1-year and 10-year US Treasuries). This study also showed that the lead time to a recession after the yield curve inverted ranged from 6-24 months. As of Friday’s close, the current 10-1 spread stands at just 0.46%, the lowest level seen since late 2007. Longer-term spreads are even tighter, with the 30-10 spread standing at a mere 10 bps. The 30-10 spread shows a similarly powerful signal of inverting ahead of a recession.
The study mentioned above clearly shows that an inverted yield curve is a pretty accurate predictor of a future recession, but it’s certainly worth discussing why this is the case. At a basic level, an inverted yield curve signals that investors believe rates will fall meaningfully in the near future. The function of long-term rates being lower than short-term rates reflects the investors’ desire to lock-in this longer-term rate, reducing reinvestment risk, which is obviously higher in shorter-term bonds. A rapid fall in rates is typically associated with a recession, as investors shed exposure to higher-risk assets in favor of safer assets like treasury bonds. Also, fears of a recession could also lead investors to conclude that the Fed would likely slash short-term rates dramatically in effort to dampen economic weakness.
The extent to which an inverted yield curve is merely coincident to a future recession or in fact helps cause a recession is more debatable and related to the impact of an inverted curve on the financial system. It is obvious that an institution that profits from the positive spread between short- and long-term interest rates (most notably banks, community banks in particular) stand to be hurt from an inverted curve. Banks, which pay short-term rates to depositors and receive longer-term rates from loans made, may see an inverted curve as a disincentive to write new loans. To the extent that this leads to reduced lending activity and tightening credit, it could certainly cause further economic weakening. In addition, significantly higher short-term rates impact most floating-rate debt instruments like adjustable-rate mortgages and floating-rate bank loans. As we saw in the housing crisis last decade, the reset of adjustable-rate debt can severely burden borrowers, particularly those that are overindebted. This phenomenon can certainly exacerbate deteriorating economic conditions.
We should point out that the yield curve has not yet inverted, and a recent forecast by Morgan Stanley doesn’t see the curve turning negative until mid-2019. This timeline would put off a potential recession to late 2019 through potentially as late as 2021, if history is any guide (see the San Francisco Fed study mentioned above). And, while an inverted yield curve is a pretty clear indicator of economic weakness ahead, a flat curve environment like we are currently experiencing is less clear. On one hand, the upward trajectory of short-term rates that we have seen over the last year signals investors expect increased inflation, at least in the short-term. The movement in longer-term rates has been more subdued, which could mean investors are less worried about persistently higher inflation over time. We certainly fall into the camp that believes the US faces a prolonged period of structurally lower interest rates, driven by demographic trends and the disinflationary impact of excessive debt, both for the government and private sector, among other factors.
Signals based on the US yield curve only make up a small part of our approach, but an inversion of the curve, should it come, would certainly signal danger ahead for growth-sensitive assets (stocks, real estate, etc.). We know that recessions generally lead to pronounced selloffs in stocks, so an inverted curve signal would be an opportunity to take risk off the table, raising cash to put to work at more attractive levels. The question of timing is certainly a challenge; as we mentioned above, the range of lag time between an inverted curve and recession is 6 months to 2 years, meaning investors cannot use an inverted curve as a short-term trading signal, but can potentially use it to position our portfolios strategically for the medium-term. The US is overdue for a recession; in our history, we have averaged one every 7 years or so, and have not had one since the end of the Great Recession in 2007-2009. One may not come in the next few years, but if it does, it will likely be preceded by an inverted yield curve, making this a worthwhile signal to follow, and one that may give investors ample warning ahead of a potential downturn.
-A.G.
Thank you to everyone for your feedback. Please feel free to reach out at any time with questions or comments.
Sincerely,
Arthur Grizzle & Charles Culver
Managing Partners
Martello Investments