Meh Markets: Though stocks have fallen considerably this year, valuation in equity markets remains mixed, but down from extremely overvalued levels.
What now for fixed income?: Rising interest rates have improved the risk/return profile of investment grade bonds. Currently, lower-grade bonds still seem risky based on tight credit spreads.
Somebody’s got it wrong in real estate: A huge, unsustainable spread has opened up between public and private real estate values.
War in Europe, political unrest across many major companies, inflation, economic uncertainty, rising rates, stock markets falling, and most importantly to certain corners of the internet, the collapse of multiple cryptocurrency scam companies. I’d imagine many of you are ready to close the books on 2022 and start anew next year.
Indeed, after a small head fake to start the fourth quarter, it seems that the stock market is going to lifelessly fade into the end of the year. Despite that, we see in the ashes of the selloff this year the smallest green shoots of opportunity emerging in some asset classes.
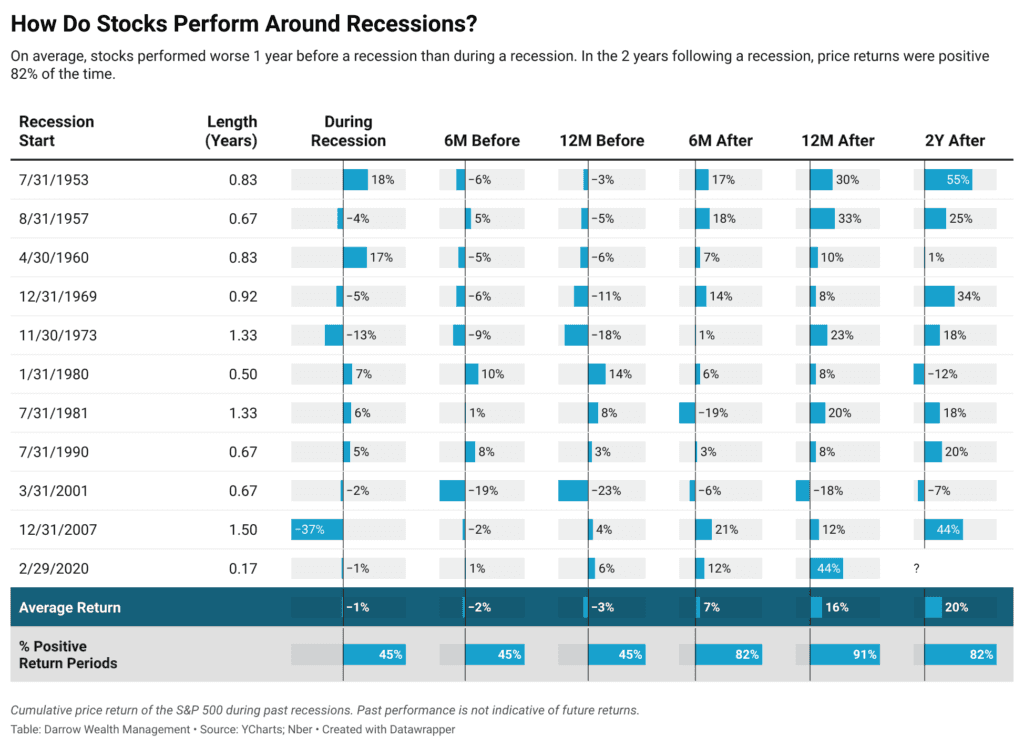
“Wait!” you say – there’s a recession coming! Markets always crash during a recession, right? Well, no. A recent article in Forbes shows the counterintuitive results of a study by Darrow Wealth Management that in the recessions since 1953, stocks fall most in the lead-up to recession rather than during the recession itself. There’s a lot to unpack here; the key point is that every recession is different, and the market’s reaction to the recessionary period (before, during, and after), isn’t set in stone. The S&P 500 has fallen nearly 30% this year peak-to-trough. Could it fall more in a recession? Yes, certainly. But based on history it’s far from certain. Stocks aren’t the only affected asset class. The pronounced rise in interest rates has reset values across all asset classes, some of which will perform better in recessions than others.
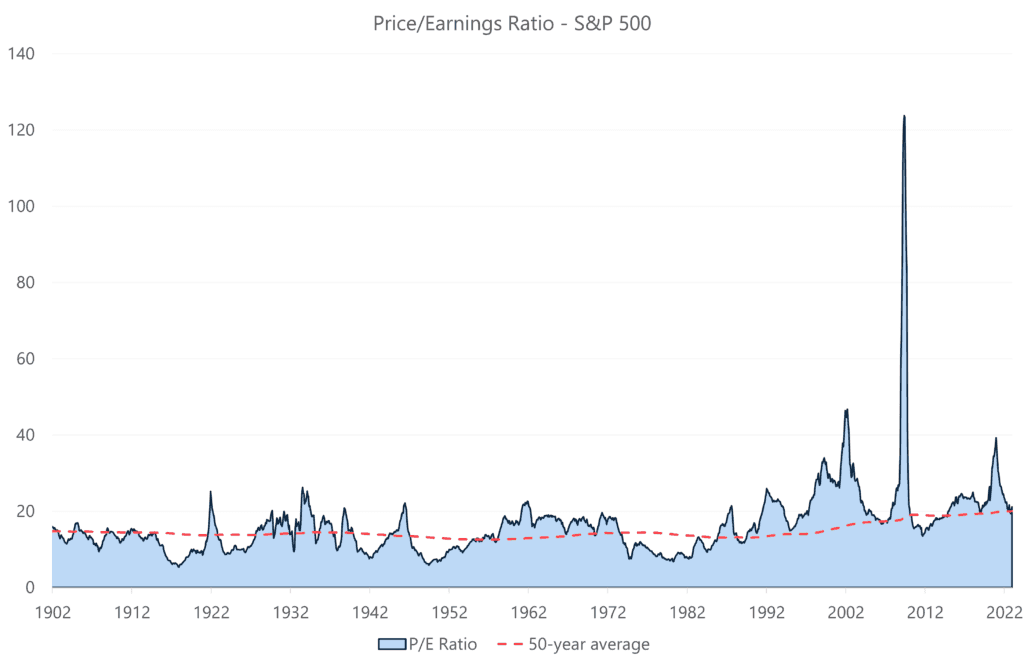
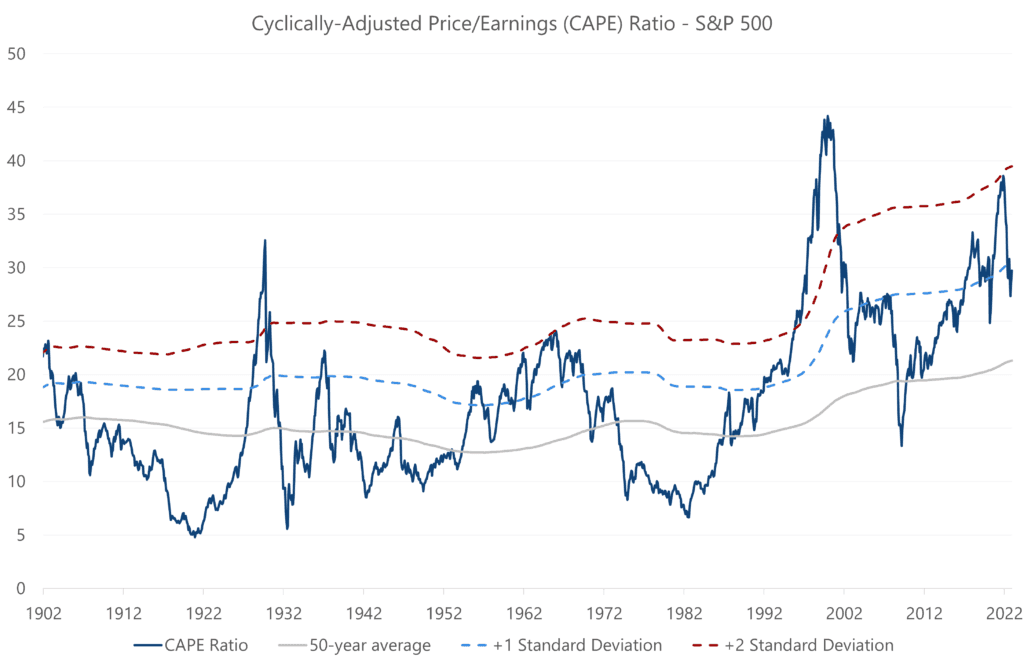
So, doom and gloom isn’t guaranteed if we go into recession next year, but what do we think about the stock market now? It’s a very unsexy take, but I am not ready to take a strong stance on the current market either way. I think the best way to describe our current outlook is... Meh, with perhaps a shrug thrown in for emphasis. Looking at equity valuations, for example, signals look pretty mixed: the S&P 500’s Price/Earnings Ratio recently crossed under its 50-year average after spending years above it, indicating that valuation is improving; Shiller’s cyclically adjusted price/earnings ratio (CAPE) is above its long-term average, but not at the extreme levels of overvaluation we’ve seen in previous years.
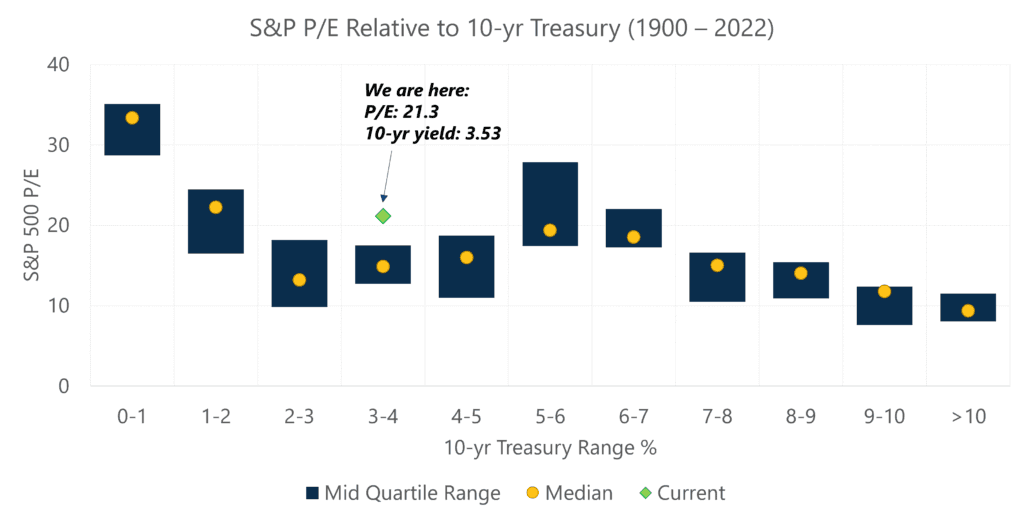
However, when you compare the market’s P/E to the level of interest rates, you’ll note that on a historical basis, current interest rate levels typically coincide with much cheaper valuations than we see currently. What does this mean in aggregate? Valuation is improving but is certainly not at levels that would make us pound the table and scream buy, buy, buy.
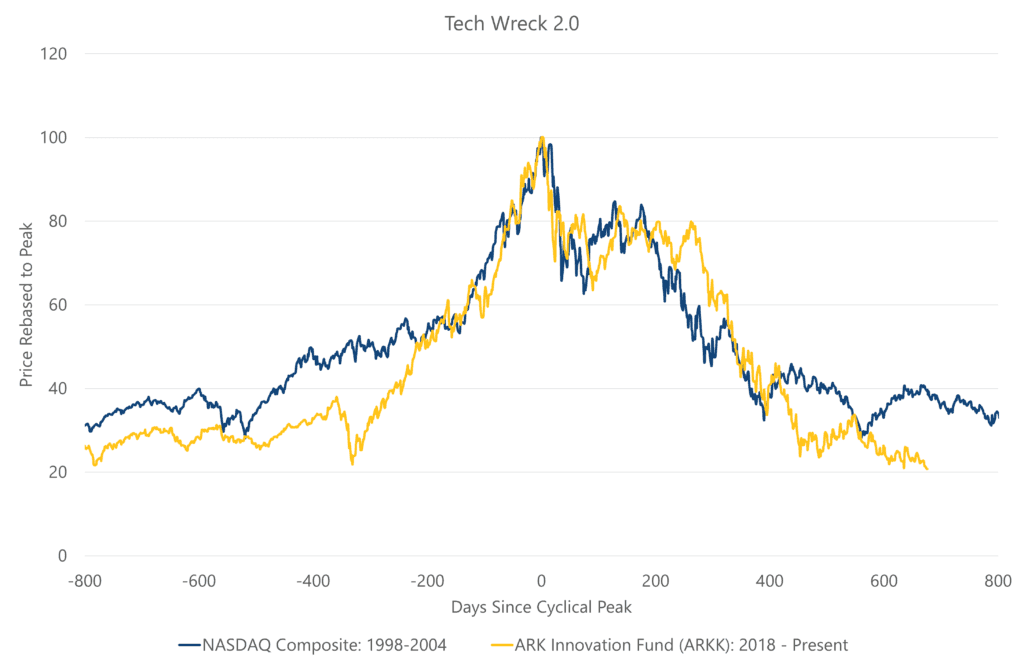
One area of extreme market clarity is the punishing losses in the “hyper-growth” stocks. We refer to this as the Tech Wreck 2.0, due to its similarity to the Dot-Com Bubble Bust in the early 2000s. You can see this in the chart below, which compares the NASDAQ from 1999-2002 to the ARK Innovation Fund ETF (ARKK) as a proxy for today’s hyper-growth universe.
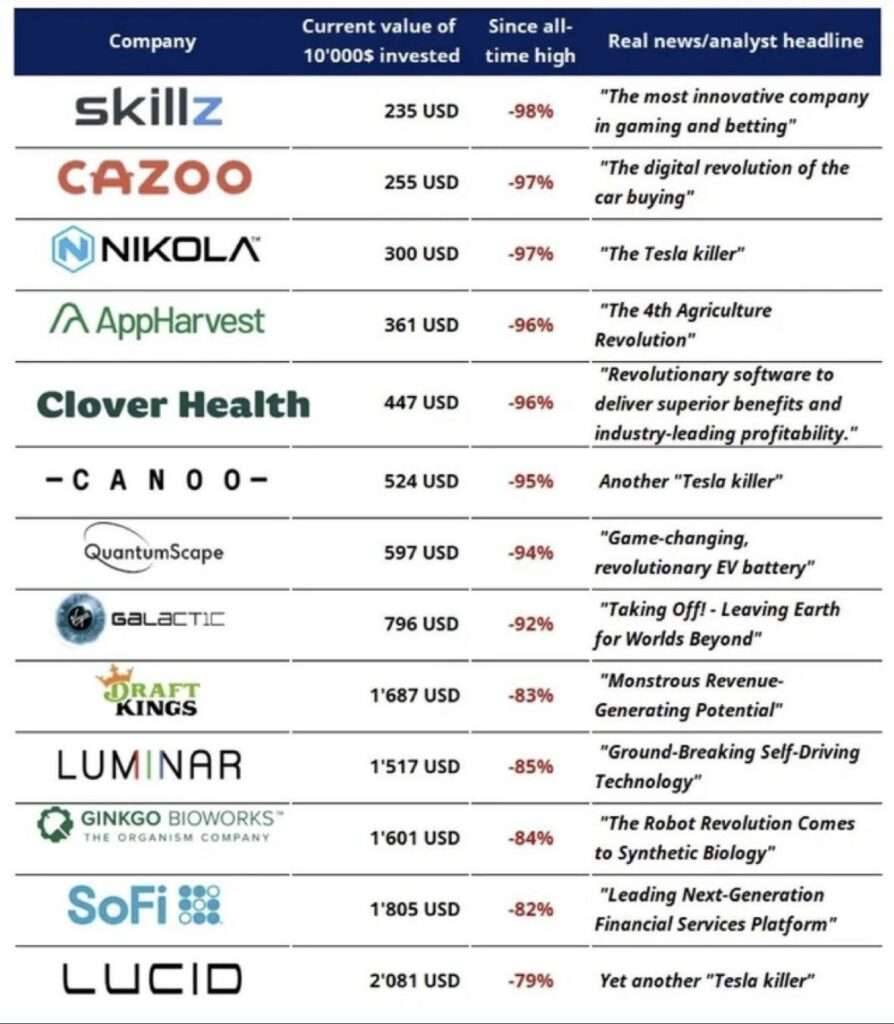
The cohort of companies that launched via SPAC are another excellent example. I am very confident that the next wave of generation-defining products and world-leading companies will emerge from this wreckage. The question for investors is always which companies will be successful and which ones will fail. Put another way, as this current growth stock bust turns to boom, who will become as the next Amazon or Google, and who will be left on the scrap heap of history with Pets.com and AskJeevs?
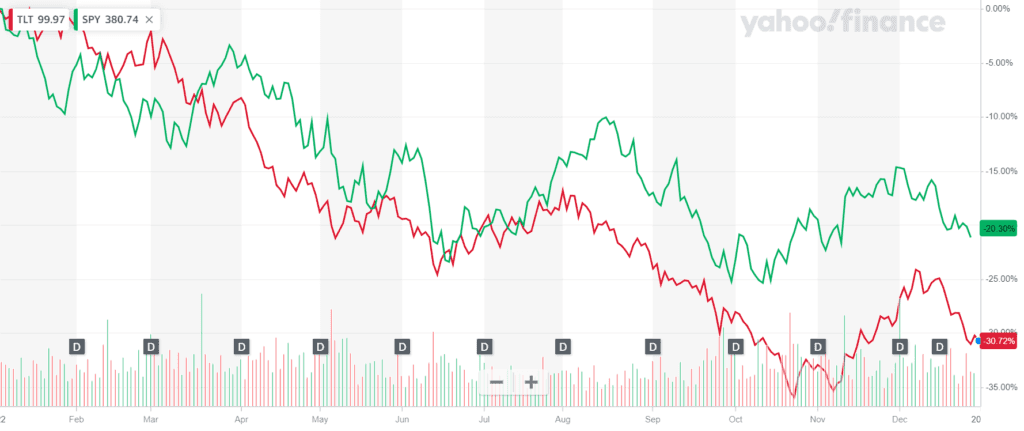
For a generation or more, the financial community was pretty much in lockstep on the role of bonds in a portfolio. Fixed income is supposed to provide a mix of current income and diversification to help protect accounts during times of equity market weakness. For most of the last 50 years, this has been a reliable relationship. Inflation, almost by definition coupled with rising interest rates, challenges these preconceived notions, however. We wrote about this many times over the years, as it was clear that an unwinding of global zero/negative interest rate policy and potential inflation would cause this “short correlation” assumption to no longer hold. Indeed, at one point this year, long-duration fixed income was down as much as 37% and continues to underperform the S&P 500 on a year-to-date basis.
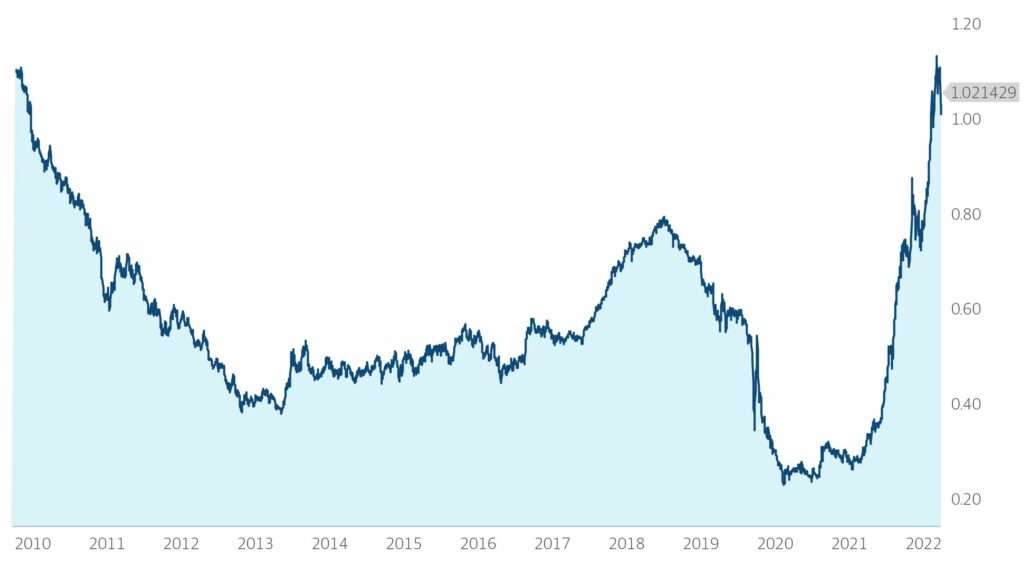
An interesting question now is how to think about fixed income moving forward given elevated rates, high-but-falling inflation, and prospects for a recession next year. Yes, yields are higher across the board, but how do investors measure value in this climate? We like the concept of yield per unit of duration, also known as the Sherman Ratio. This gives investors a sense of how well they are compensated for taking interest rate risk. By dividing yield by duration, the Sherman Ratio tells you how much rates must rise to cause price depreciation in the bond large enough to wipe out a full year’s worth of bond interest. Remember, if interest rates go up, the price of a fixed-rate bond will fall. Looking at the Bloomberg US Aggregate TR – Intermediate Index as a benchmark, we can see the pretty dramatic improvement in the “value” of taking interest rate risk. The Sherman Ratio on the index bottomed out at 0.23 in early 2021, as interest rates plummeted to historic lows. Again, this means that interest rates would only need to rise 0.23% for the price losses to offset all of the bond’s interest for a year. Since that time, the Sherman Ratio on the index has improved by over 4X, closing October at 1.02. By this metric, core fixed income is as compelling as any time in last decade, at least on this risk-adjusted basis.
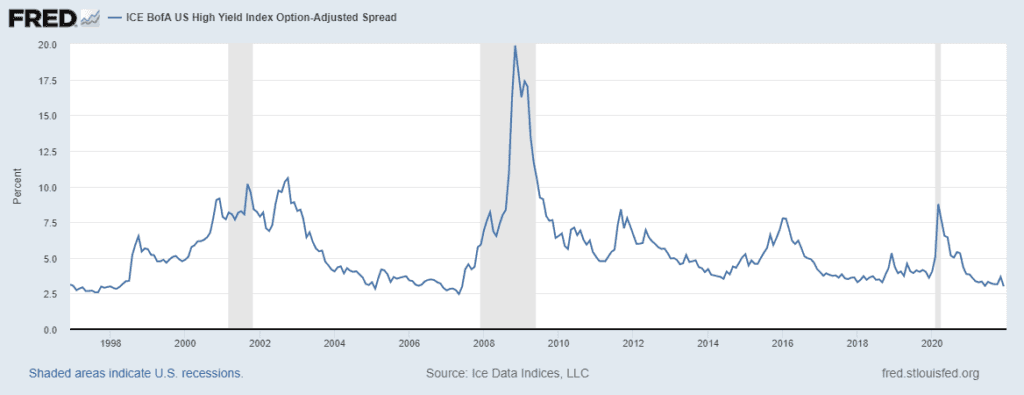
Contrasted against the growing value in investment grade fixed income, the high yield credit market doesn’t look as attractive to us by comparison. Sure, yields available on junk bonds have risen along with everything else. Credit spreads, however, remain near historically tight levels, reflecting investor optimism about less creditworthy borrowers’ ability to navigate an economic recession.
A recent paper by Janus Henderson shows the widening gap between valuations of public real estate vehicles (Public REITs) and private real estate funds. Janus’ research shows this gap forming only at times of considerable market turmoil, with notable examples in 2000, 2008, and today. Indeed, at the time of this writing the Vanguard Real Estate ETF (VNQ) is down over 20% on the year while the NCREIF ODCE Index, which tracks private open-ended real estate funds, is up over 13% YTD through the third quarter. I’m sympathetic to the view that some private investments can deliver a premium to investors, but that’s not what’s going on here.
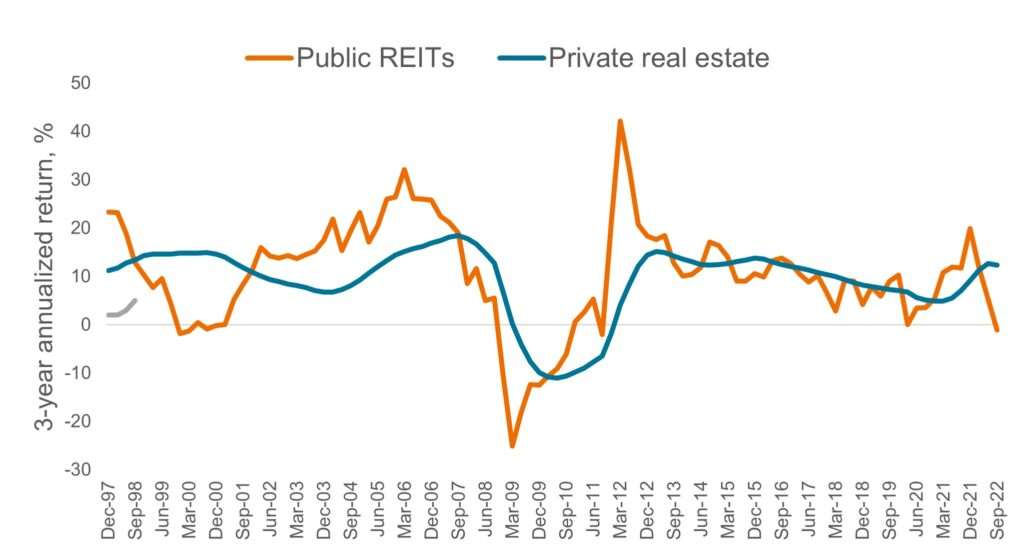
What could be causing this gap? Maybe an overreaction to rising rates and fear of recession disproportionately impacting the publicly traded funds, which are more easily sold than their private counterparts? Perhaps the private funds are battling to defend their property valuations to the death, with poor marks in these funds inevitably to follow only once these stale valuations become untenable? Perhaps both? We think investors, particularly with a long-term view, can begin looking to the public real estate market as a potential opportunity to pick up attractive yields, though we encourage investors to be selective. We favor specialty real estate asset classes with business models that are, in our view, more resilient to economic disruption. Yields and valuations aren’t at “load up the truck” levels yet, and these assets could fall further, but the sell-off has caused us to give the REIT market a long look.
The common thread throughout the themes we discuss above is that it is important to pick your spots when times are tough. Things have changed. We’re certainly not in the risk-on/risk-off framework that characterized so much of the post-Great Financial Crisis decade. Certain segments of markets look better than others to us. That’s not to say that stocks couldn’t fall further, or rates won’t take another sharp move higher. Those scenarios are possible, but our view is that decision-making in investing should be more a continuum than a single datapoint. As we sit here, with equities 20% off their highs, interest rates at near decade highs, and 5 consecutive months of disinflation, some opportunities seem to be emerging. Incrementally. Nobody is going to waddle out on to CNBC, ring a bell, and let you know when to pile in. Would you believe them if they did?
Stay safe out there, and happy holidays.
Artie