Market Volatility: Global equity markets, and especially the US stock market, have shown remarkable resilience despite elevated valuations and an onslaught of negative news. The last few months have seen increased dysfunction in Washington, rising geopolitical tension particularly saber-rattling from North Korea and increased terrorism in Europe, weak economic growth, and the prospect of the Fed unwinding nearly a decade of stimulative monetary policy. Nevertheless, market volatility sits near historic lows on both an implied and realized basis.
Markets: Headline stock indices continued to rally in May. Since the November US election, the S&P 500 is up nearly 15%, and has posted gains in 6 of 7 months. Technology continues to lead the market higher, as the sector index has returned over 20% year-to-date. Bonds have rallied in recent months despite the Fed guiding interest rates higher, as intermediate and long-term treasury yields have fallen meaningfully in 2017. The flattening yield curve has impacted the Financials stocks, which initially received investor interest after the election but have faded in recent months as meaningful reform from Washington seems less likely.
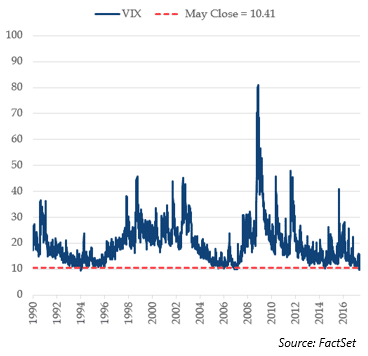
Structurally, investors can analyze market volatility in two distinct ways: realized volatility (how volatile something has been historically) and implied volatility (expectations for future volatility based on the price of derivatives). In both cases, US stocks have shown dramatically low levels of volatility in recent years. Implied volatility is easiest tracked using the CBOE Market Volatility Index (VIX), which derives its price from the implied volatility of options on the S&P 500 Index. In May, VIX broke under 10 for the first time since 2007. Indeed, there have been only two other periods since 1990 that the VIX reached a 9-handle; one was in late 1993 through early 1994, and the other in late 2006 through early 2007. In each case, the index ultimately re-rated to higher levels, though in only the more recent example of 2006-2007 was this eventually accompanied by lower equity prices.
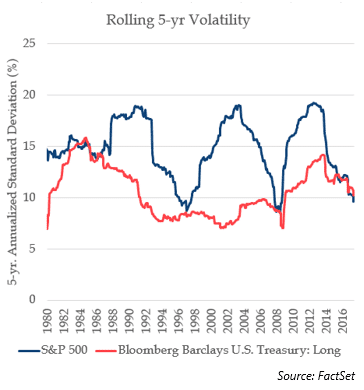
In realized terms, equities have delivered volatility that ranks among the lowest in several decades. On a five-year basis, the S&P 500 has posted an annualized standard deviation of 9.6%, compared to a long run average of nearly 16%. By comparison, an index of long-term government bonds has produced a five-year standard deviation of 10.2%, which is roughly in-line with long-term averages. So, the headline US stock index has posted lower return volatility than an asset which is considered, at least on a credit risk basis, to be risk-free. The next chart shows rolling 5-year standard deviations for the S&P 500 and a long-term government bond index.
There are a few obvious takeaways here:
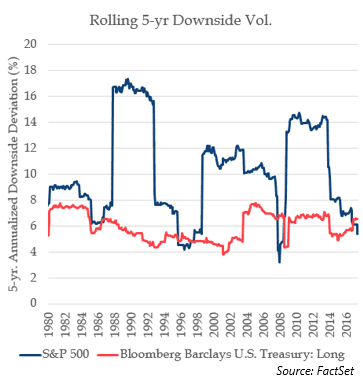
Since general volatility, as measured by standard deviation, is not a perfect proxy for risk, we also present a chart of realized downside volatility (using downside standard deviation, which only considers negative periods) below. Once again, you can see both the mean-reverting nature of this series, the extremely low levels compared to both history and bond volatility.
As evident in the first chart above, the VIX (implied volatility) can remain low for extended periods of time. The VIX simply reflects expectation about risk in the future, and the price investors are willing to pay to hedge that risk. Therefore, a low level of implied volatility simply reflects extremely bullish investor expectations and indifference towards risk. Similarly, there is nothing to say realized volatility can’t continue to trend lower. Over the last few years, and certainly over the last several months, the equity market has shown a tendency to ignore negative news and rally nevertheless. In fact, during the 15% rise in the S&P 500 following the US election, the market shook off increased dysfunction and potential scandal in Washington, rising geopolitical tensions and terrorist activity, potential political upheaval in developed Europe, the prospect of continued tightening by the Fed, and a very weak 0.7% first quarter GDP growth number out of the US. Even May 2017 delivered lower volatility, even with a 46% one-day gain in the VIX, which was erased in a matter of days.
There are endless potential reasons for the market’s resilience over the last few years, including easy monetary policy by the Fed, ZIRP/NIRP from global central banks pushing investors into riskier assets including stocks, and fund flows dominating the market due to the growing force of passive investors. Perhaps these forces can continue to support the market indefinitely, leading investors into a glorious post-volatility world. However, with the Fed recently announcing plans to unwind its enormous bond portfolio, the “central bank put” could be in question. In addition, flows from passive vehicles could prove a double-edged sword for markets, meaningfully impactful on the way down as on the way up, particularly for funds with significantly mismatched liquidity.
Low volatility does present inherent risks to portfolio construction, particularly for certain types of strategies that use backward-looking volatility metrics for position sizing and risk management. A well-known version of this is a metric known as Value-at-Risk (VaR); VaR’s role in the 1998 LTCM downfall and 2007-2008 credit crisis has been widely covered. Essentially, these types of models rely on, among other things, trailing historical volatility to infer how much a portfolio can lose in a given period. With such a prolonged period of benign markets, these strategies are susceptible to volatility shocks, as complacent investor behavior causes an undervaluation of the real potential losses of the portfolio. The real risk in the portfolio is only realized ex-post, when the volatility environment changes and a market shock occurs. Particularly for strategies with leverage, this could potentially lead to a cascade effect, whereby increased volatility causes further selling pressure, further raising volatility, and so on.
To be clear, we are not forecasting another 2007-2009 scenario, but we are mindful of the dangers from persistently low volatility on investor behavior and portfolio risk modeling, even more so when leverage is added to the equation. Whether this is the calm before the storm remains to be seen; bubbles are always easiest spotted with the benefit of hindsight. However, at a time when valuations are sky-high by most metrics, margin debt remains near all-time highs, and geopolitical risk is rising, we view the historically low market volatility as a potential sign of apathy, not an all-clear signal.
Domestic stock indices posted mixed returns in May, as political dysfunction and rising geopolitical tensions offset expectations for strong quarterly earnings. US Large Cap stocks, as measured by the S&P 500 Index, gained 1.4%. US mid-cap stocks, as measured by the S&P 400 returned -0.5% and the Russell 2000 small-cap index finished the month with a -2.0% return. International developed stocks, as measured by the MSCI EAFE Index, gained 3.8%, while the MSCI Emerging Markets Index rallied 3.0%. At the sector level, Technology posted a 4.4% gain for the month to bring year-to-date gains to 20.5%. Technology stocks have benefitted by heightened fund activity, with a recent Bank of America study indicating that active funds are overweight technology stocks at record-breaking levels on a relative basis. Energy continued to post weak returns, as year-to-date losses reached -12.5% after a -3.4% return in May. Despite rising US Production, Energy stocks have been weighed down by a falling oil price. Financials also lagged with a -1.2% return, as continued dysfunction in Washington has made investors skeptical that President Trump will be able to enact financial deregulation and tax reform.
The S&P 500 traded quietly for most of the month, with a brief drawdown and subsequent recovery in the mid-month providing the only volatility in May. The Index fell 1.82% on May 17 on reports of President Trump’s interference into an FBI investigation of ousted NSA Director Michael Flynn. The move sent the CBOE Market Volatility Index to 15.59, up over 46% for the day; the move in the VIX was the 7th largest one-day move since 1990, though market volatility ultimately retreated to its previous benign levels to close May at 10.41.
Fixed Income markets were generally positive, with the Bloomberg Barclays US Aggregate Index posting a 0.8% gain for May. After rising to 2.41 by May 9th, the US 10-year Treasury Yield fell sharply to close the month at 2.21%, 8 bps lower than April’s 2.29% close. Similarly, the 30-year closed the month 9 bps lower at 2.86%. High yield credit spreads, as measured by the BofA Merrill Lynch US High Yield Option-Adjusted Spread, were mostly flat for the month, tightening by 1 bp to close May at 3.74%. The Bloomberg Barclays High Yield Bond Index is now up 4.8% YTD, and has rallied over 13.6% over the last 12 months.

The S&P GSCI Total Return Index returned -1.5% in May, as the commodity complex was once again driven lower by the Energy sub-index, which returned -2.6%. After rising briefly on a new trade agreement between the US and China, Natural Gas fell sharply on milder than expected weather and bearish supply data. WTI Crude Oil opened the month at $49.33/bbl. and closed slightly lower at $48.32/bbl. The fall in oil came despite a nine-month extension of production cuts from OPEC, as the cartel attempts to stabilize the price of crude.
After rising to a 3-year high in the months following the election of President Trump, the US Dollar Index has declined steadily in recent months. The rally in the Index, driven by an expectation of Trump’s pro-growth economic agenda and a constrained fiscal policy by the Republican-led Congress, has faded as a string of political scandals has beset the administration and Congress has been as of yet unable to deliver on its promises of reform. The Index, which measures the US Dollar against a basket of 6 foreign currencies, fell 2.1% for the month and is down 5.1% year-to-date.
We’re thankful for the continued interest and feedback. Please feel free to contact us with questions or comments.
Sincerely,
Arthur Grizzle & Charles Culver
Managing Partners
Martello Investments