Greed, Fear, and Fallacy: Behavioral economics and finance combine financial theory with psychology to challenge the assumptions of traditional models, and we applaud the recent recognition of the field with Dr. Thaler’s Nobel Prize. In today’s market environment, characterized by Fed-interpretation, passive fund flows, and geopolitical news, the arguments made by the behavioral camp are as important as ever. In this commentary, we analyze household ownership of equities as a proxy for herd behavior, and share analysis showing the relationship between household equity ownership and future returns.
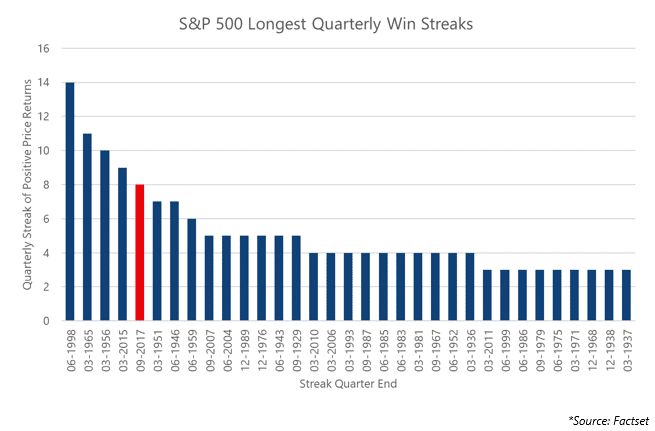
September Market Recap: The S&P 500 capped off a strong third quarter with a 2.1% gain in September. The quarterly gain of 3.96% was the index’s eighth consecutive quarterly gain, the fifth longest streak on record. Energy stocks benefitted from rebounding oil prices, while Utilities struggled. The Federal Reserve announced plans to begin unwinding its bond portfolio, which sent interest rates higher in the US and Europe. The Fed’s announcement caused the US Dollar to strengthen against most currencies and weighed on inflation-sensitive metals, including Gold, which traded down 3.3% for the month.
Earlier this month, Richard Thaler received the Nobel Prize in Economics, and his recognition was long overdue. In a world where conventional economics is driven by simplifying assumptions — assumptions like “markets are efficient” and “investors are rational” — Thaler’s contributions to the field as one of the founding fathers of behavioral finance bring a realistic perspective. The underlying principles of behavioral finance, blending financial theory with psychology, accept the emotional and cognitive biases of most investors. Instead of assuming investors are rational, Thaler and others acknowledge that, on the contrary, most investors are irrational, emotional creatures that are driven by a combination of greed, fear, and fallacy, and that it is these behavioral issues that can cause bubbles and overreactions.
Despite tidy econometric models that peg investors as rational creatures, we value the contributions of the behavioral camp; we believe that emotions and irrational decision-making tend to govern investor behavior, oftentimes to the detriment of the investor. There are numerous behavioral biases prevalent in investing; some of the more notable include loss aversion (losses are generally 2-3X more painful than the positive feelings associated with similarly sized gains), confirmation bias (only pay attention to opinions that agree with you), and endowment bias (what we own is more valuable than what we don’t). Ultimately, these behavioral fallacies can result in investors buying high (chasing) and selling low (out of frustration and fear), the consequences of which are long-term wealth destruction.
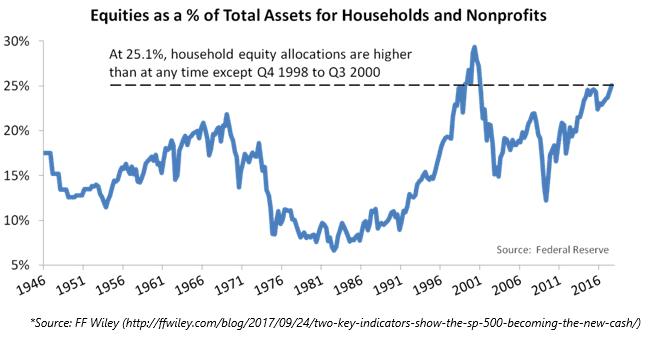
One of the key concepts in behavioral finance is called herding, which is the tendency of individual investors to follow the actions of a larger group. Herd behavior happens because people implicitly trust the collective wisdom, and because of the pressure to conform. Think of the 1990s technology stock bust or the 2007-2008 housing crisis; part of the driving force of the bubbles preceding those crises was a fallacy that suggested “everyone is doing it, so it must be right, and I should do it too.” I saw some charts recently that brought herd behavior to mind; in a post titled “Two Key Indicators Show the S&P 500 Becoming the New ‘Cash’”, FF Wiley (ffwiley.com) highlighted that investors hold more equities as a percentage of total assets than any other time since 1946 except during the height of the dotcom bubble in 1998-2000. Wiley takes his analysis a step further by showing that high equity ownership is generally followed by low 6-10-year future returns, while low equity ownership is generally followed by higher returns. Some of this growth is certainly caused by the price of the market itself; household ownership of equities will rise organically as markets rise, as equity ownership percentage will fall as stock prices fall. The fact remains that, if history is any guide, the current level of equity ownership by households is associated with very low future returns.
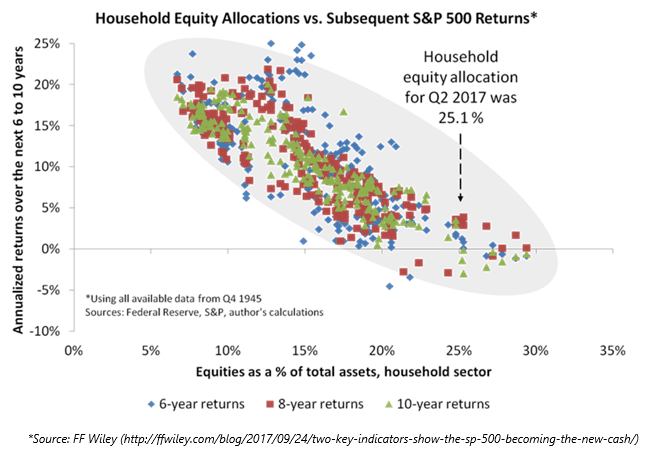
Part of the reason this relationship may exist is due to valuation; high equity ownership periods are generally associated with high valuation periods. Another reason it may exist is a related construct from the fields of sociology and behavioral finance: thresholds. Sociologist Mark Granovetter, in his paper Threshold Models of Collective Behavior, identifies that group outcomes are dependent upon the various thresholds of the members. In this case, a threshold for an individual is based on how many other individuals are engaged in the behavior. In financial markets we can think of a low-threshold actor as a contrarian, meaning they favor of non-consensus ideas. Similarly, we can think of high-threshold investors as “herd,” meaning they only participate after a large amount of reassurance. The problem is that by the time high-threshold entrants are sufficiently convinced to enter the market, the majority of the trend is over and there are few new entrants (with seemingly even higher thresholds) to push the market to new heights. This would mean the highest-threshold entrants generally enjoy the lowest returns. Using the chart above as a guide, any investor currently jumping into stocks after such a prolonged bull run (which we could call a high-threshold actor) should expect below average returns over a long holding period.
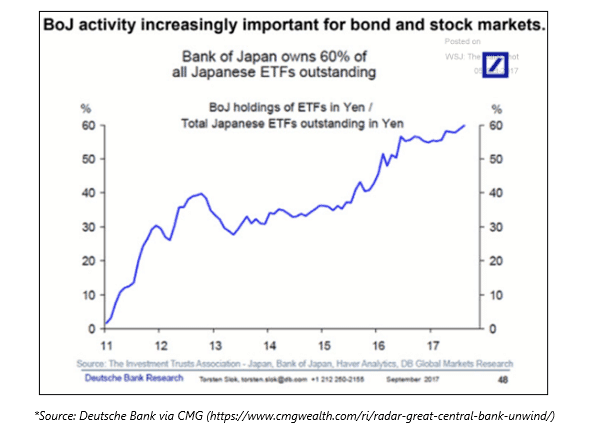
Though the threshold model may not be a pure comparable to the equity ownership charts above, we think it is fair to wonder, with household ownership approaching record levels, who is the marginal buyer of equities these days? One question that always comes up in these analyses is to wonder if “this time is different,” particularly given low interest rates globally, which push investors out on the risk curve and could theoretically cause a new higher stock ownership paradigm. Another potential answer is trend-following strategies and quasi-trend, vol-driven strategies like risk-parity, which some estimates put at $8 trillion globally in aggregate, and are natural buyers of equity markets in a stable up-trend with low volatility. Then there are the indiscriminate buyers, such as corporate buybacks, which have fallen to only $500 billion on a rolling 12-month basis. Let’s not forget the Bank of Japan, which owns an alarming proportion of Japanese ETF issuance.
As with most of our commentaries, which to date have mostly focused on historical abnormalities present in today’s markets, we present this analysis with a word of caution. The charts above say nothing about near-term market returns, and we are not forecasting an imminent crash. As we constantly stress to investors, there is nothing to say that, despite these historical anomalies, the market can’t continue to grind higher in the short-term. Indeed, the analyst community is bullish on third quarter corporate earnings, projecting earnings and revenue growth in the 4-4.5% range. At the same time, the Fed is signaling a general comfort with the state of the economy by beginning to shrink its bond portfolio in October. As we continue to point out, we do not take these data points as gospel, nor do we use them to drastically shift our portfolios. In practice, long-term metrics play an important role in our view of risk; current readings show us that risk is elevated, and long-term returns are likely to be below average.
-A.G.
Domestic stock indices rallied strongly in September, adding to already solid year-to-date performance, as investors’ expectations for a strong earnings season and the Republican tax reform plan sent indices higher. US Large Cap stocks, as measured by the S&P 500 Index, gained 2.1% for the month, while the Russell 2000 small-cap index returned 6.2%. The MSCI EAFE Index, an index of international developed stocks, rallied 2.5%, while emerging markets posted a modest loss. A strong September return capped off a solid third quarter for the market, with the S&P 500 gaining 3.96% for the quarter. The S&P 500 has now posted gains in 8 consecutive quarters, the 5th longest streak on record.
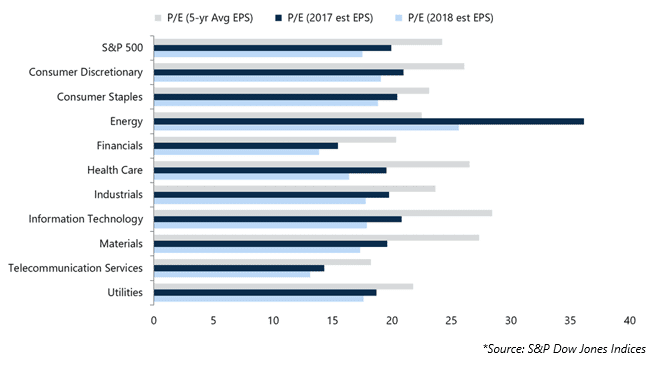
At the sector level, a rebound in crude prices sent the Energy sector up 9.9% on the month, though the sector remains in negative territory on a year-to-date basis. The Energy sector continues to grapple with a weak oil market and depressed earnings since the 2014-2016 oil slump, causing the sector to carry the highest sector valuation on estimated 2017 and 2018 earnings. The move in energy in September, as well as rising interest rates, impacted the Utilities sector, which returned -2.7% for the month. Market volatility, as measured by the CBOE Market Volatility Index (VIX) spiked in the first days of September, but trended lower throughout the remainder of the month to close at 9.51. The 9.51 September close is the lowest monthly closing price for the VIX since the index’s 1990 inception.
Fixed Income markets posted losses in September, as hawkish statements from the Federal Reserve sent interest rates higher. In mid-September, the Fed announced that it would begin to unwind its $4.5 trillion balance sheet, which was built up with purchases of Treasuries and mortgage-backed bonds following the Great Recession. The Fed signaled that it won’t actively sell bonds, but instead will choose not to reinvest a portion of bonds as they mature, starting at approximately $10 billion per month and growing to $50 billion per month over the next several quarters. Despite the Fed’s relatively modest pace, interest rates rose sharply in the United States; the 2-year Treasury rose 15 bps to 1.47%, the 10-year Treasury rose 21 bps to 2.33%, and the 30-year Treasury rose 14 bps to 2.86%. The steep rise in interest rates, coupled with a rally in risk assets, tightened high yield spreads significantly, with the BofA Merrill Lynch US High Yield Option-Adjusted Spread contracting 29 bps to close the month at 3.56%. The rally in US interest rates also impacted European bond yields, as did hawkish statements from ECB head Mario Draghi and an inflation surprise in the UK; the 10-year treasury bond for the UK rose 36 bps to close the month at 1.36%, while the German bund yield closed the month at 0.46%, 10 bps higher than its August close.
The S&P GSCI Total Return Index returned 3.3% in September, as rebounding energy prices overwhelmed weakness from Metals sub-indices. The Energy sub-index returned 5.9% for the month, though the index is down 7.4% on a year-to-date basis. The index was led by a strong rally in Crude Oil, which rallied sharply after falling in August in the aftermath of Hurricane Harvey. After closing August at $47.09/bbl, West Texas Intermediate (WTI) Crude Oil traded up throughout the month to close September at $51.64/bbl. US refinery utilization hit a 7-year low following Hurricane Harvey, but forecasters expect demand to rise as these refiners come back on line. The Federal Reserve announcement signaling its intent to unwind its balance sheet put pressure on inflationary Industrial Metals and flight-to-quality Precious Metals; in September, the S&P GSCI Industrial Metals sub-index returned -2.7%, while the Precious Metals sub-index returned -3.0%. Gold opened the month at $1,326.60/oz. and sold off steadily throughout the month to close September 3.3% lower at $1,282.50/oz.
The US Dollar Index rose modestly in September, posting a 0.44% gain to close the month at 93.076. The Index, which measures the US Dollar’s value against a basket of 6 foreign currencies, benefitted from a hawkish Federal Reserve and investor expectations about pro-business tax reform from the Republican-led Congress and White House. The Dollar rallied against most major foreign currencies, with a notable exception of the British Pound (GBP); the Pound rallied sharply following higher than expected inflation in the UK, which caused speculation that the Bank of England would face pressure to raise interest rates.
We’re thankful for the continued interest and feedback. As always, please feel free to contact us with questions or comments.
Sincerely,
Arthur Grizzle & Charles Culver
Managing Partners
Martello Investments