I don’t try to predict where the market is gonna go. It’s like a comet going through the sky. You can’t see the comet, but you can see the tail. We can see the price action, but we can’t actually ever really grasp the market... All we can see is the tail, that’s the price action, the historical prices. You can analyze charts up the ying-yang; you’re looking at the tail of the comet.
John Moulton: Bulls and Bears (1998)
If you haven’t seen the Bulls and Bears documentary from 1998, I’d highly recommend it. I watched it for probably the 10th time last week, and I can confirm that there are multiple versions available on YouTube as of the time of this writing. The documentary follows a group of traders on the Sydney Futures Exchange, and focuses particularly on John Moulton. Bulls and Bears has so many interesting components: the relative infancy of screen trading. Navigating the ups and downs of managing money. The impact of unexpected geopolitical shifts. For those interested in trading (or just the market in general) the film also has several amazing nuggets of wisdom, the most enduring of which is highlighted above.
The “Tail of the Comet” is a logical fallacy. It grips all investors at some level. Unless you are a blind speculator, you certainly incorporate past data to get a sense of current market dynamics and future expectations. Consciously or unconsciously, it’s human nature to do so! We strive to find patterns everywhere. Even fundamental strategies incorporate the past to some extent. For example, recent earnings growth trends to forecast future earnings. But pure technical approaches are driven entirely by the tail of the comet. The simplest example of this is a momentum-based approach, which simply invests in the securities showing the greatest performance. Another example is the use of volatility as a weighting scheme, whereby lower volatility securities are given a higher weight in a portfolio. We have discussed the danger of using these weighting schemes in levered strategies many times.
That’s not to say that these strategies are necessarily inferior to any other. We certainly utilize many technical factors in our strategies at Martello. Particularly for technical strategies, though, we believe it is important to understand when a strategy type should perform well and when it might suffer. In geek speak, this is sometimes referred to as “regime analysis.” It allows a portfolio manager to understand why a strategy might be making or losing money.
Technical strategies, particularly those that use momentum/trend as their primary signal, have two basic weak points: technical shifts and shock risk. Technical shifts are periods where what the strategy predicted was going to happen isn’t happening any longer. Trend/momentum investors rely on an upward-moving security to continue to move upwards to make money when they are long, or a downward-moving security to continue moving down if they are short. But should the security hit an inflection point (the trend reverses), or even worse, encounter a choppy market (whipsaws in an up and down fashion, confusing the algorithm), the strategy will be caught offside until it can detect a new trend, or at least figure out that the old one is no longer there. The timing depends entirely on the algorithm. Some can trade out quickly, while some will require months of evidence that the trend has discontinued.
While technical shifts are more prevalent, shock risks are perhaps an even larger danger to trend/momentum strategies. These happen less often and are characterized by a sudden and unexpected change in trend caused by some unforeseen event. Think a major bank failing, a geopolitical headline, or a surprise from some monetary authority like the Fed. Shocks are called shocks because these types of events almost always happen against consensus. Nobody likes to get shocked. It’s very rare that investors are “shocked” and hold their position. It’s in human nature to panic and protect, so regardless of the speed of your algorithm, if you’re caught offside, you tend to feel the pain.
It’s no surprise that with whipsawing in the equity market this year and in bond markets over the last two years that the current period would be a difficult environment for these strategies. Furthermore, and not to get too political here, the “policy via tweet” stance of the current administration in the US has served to increase shock risk, particularly regarding trade policy as of late. But even though these types of strategies may have not been faring well recently, that regime analysis has indicated that it is a poor environment, and the equity market looks so good on its surface right now, it is still a wonderful idea to include such a strategy in your long-term portfolio due to the way it interacts with other strategies in your portfolio.
As we have discussed many times, using a variety of strategies to allocate capital is an important way to manage the risk in your portfolio. Since Harry Markowitz in 1952 introduced modern portfolio theory, the financial industry has touted the importance of diversification. If you’re like most investors, you’ve surely got stocks and bonds in your portfolio. This diversification of asset classes is a common technique, but with low interest rates beginning to rise and near-record high equity valuations, traditional diversification could falter in the next significant downturn. Our January note highlighted that the correlation between stocks and bonds isn’t reliably negative. Put another way, what if stocks and bonds fall at the same time? Diversifying strategies is a different way to go. You begin with various investment strategies that aim to make money in good times, protect capital when things take a turn for the worse, and most importantly have low correlation to one another. Our research shows that, when you combine them together, you get a portfolio that is greater than the sum of its parts.
Back to the point. Because trend/momentum strategies in general are not highly correlated to stock markets over long periods of time, including such a strategy in your portfolio can help improve returns and reduce volatility – to “smooth the ride,” if you will. Below, we show a chart of 3-year rolling returns of the S&P 500 and the SG Trend Index, which tracks the leading trend-following managers in the Managed Futures space.
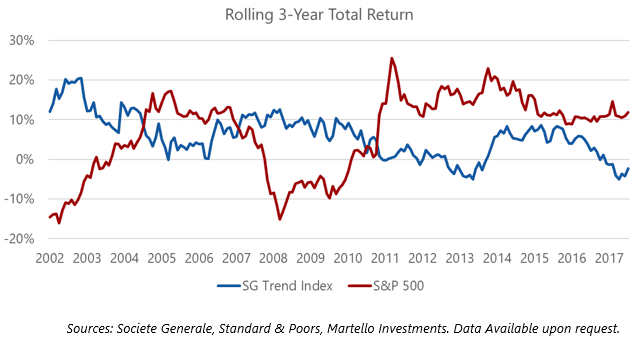
At first glance, it’s hard to see any tangible benefit to the Trend Index, as returns have lagged the headline stock market for a long time while both indices have similar volatility (about 14% annualized). Based on the chart above, you’d probably be surprised to find out that these two indices have returned approximately the same over this period. Even better, because they have a negligible correlation to each other (approximately -0.12), a 50/50 blend of them improves the overall return while dampening volatility, significantly improving risk-adjusted return.
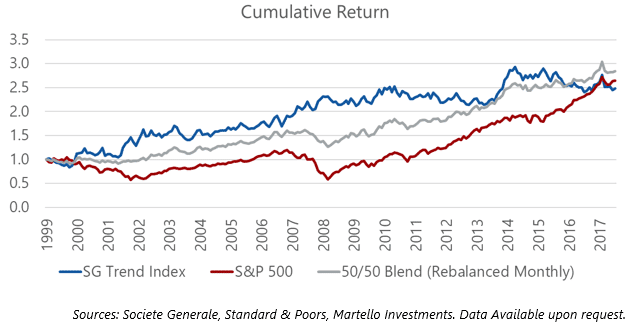
To reiterate, this speaks to one of our core beliefs here at Martello: the importance of strategic diversification. Instead of merely diversifying asset class exposure, investors should look to diversify strategies and strategy types. In the chart above, you can see the benefit of combining a static equity position with an uncorrelated trading strategy. Our multi-strategy approach expands on this by combining multiple uncorrelated strategies into a single portfolio. Factors may fall in and out of favor over time, but our research and experience show that combining them in a disciplined framework is the best methodology to avoid chasing the tail of the comet.
Thank you to everyone for your feedback. Please feel free to reach out at any time with questions or comments.
Sincerely,
Arthur Grizzle & Charles Culver
Managing Partners
Martello Investments